
使用perl制作数据图表
时间:2010-09-04
来源:互联网
今天看到一篇不错的文章,是利用perl进行制作数据图表,,自己实验下,效果还不错。
1,首先要下载一个 ChartDirector 软件包
下载地址:
http://www.advsofteng.com/download.html
2,安装ChartDirector
使用 perl -V 查找得到 perl 的@INC,将 lib 下的内容copy到INC的任一路径中。
3,复制以下 perl 制表脚本,保存为 chart_create.pl
[root@localhost ~]# more chart_create.pl
复制代码
4,脚本用法如下:
[root@localhost ~]# ./chart_create.pl
数据文件格式如下:
[root@localhost ~]# more data
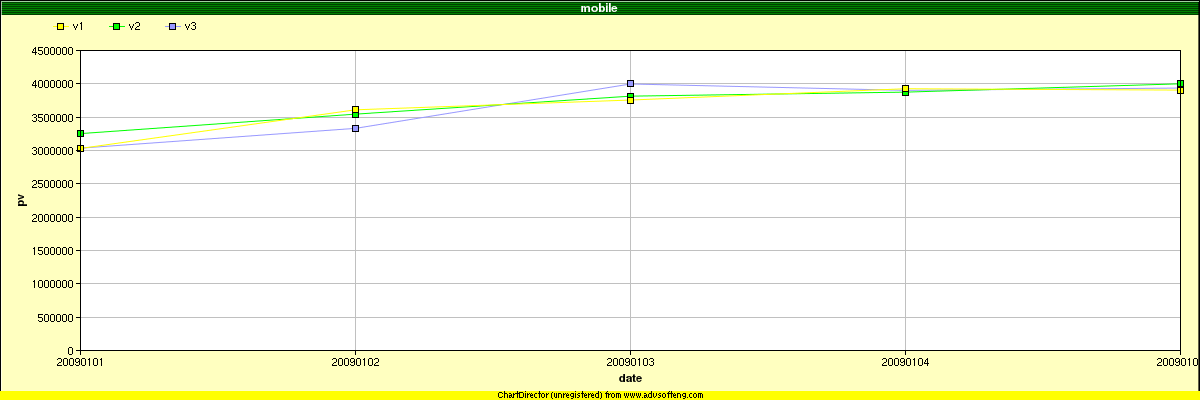
5,运行此脚本后,制图表如下:
复制代码
效果如下:
 复制代码
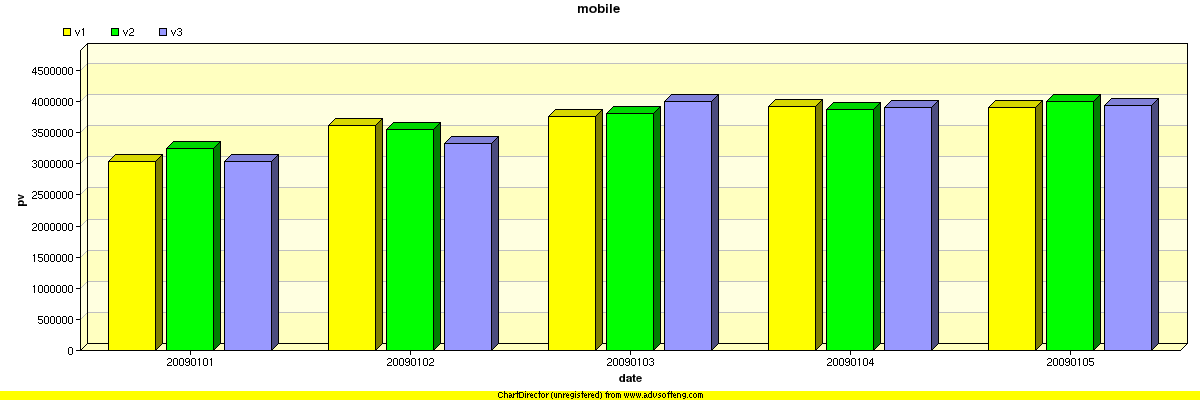
效果如下:
复制代码
效果如下:
原文来自http://blog.chinaunix.net/u/25264/showart_1918205.html
1,首先要下载一个 ChartDirector 软件包
下载地址:
http://www.advsofteng.com/download.html
2,安装ChartDirector
QUOTE:
[root@localhost ~]# tar -zxvf chartdir_perl_linux.tar.gz
[root@localhost ~]# cd ChartDirector/
[root@localhost ~]# cp -rf lib/* /usr/lib/perl5/5.8.8/
[root@localhost ~]# cd ChartDirector/
[root@localhost ~]# cp -rf lib/* /usr/lib/perl5/5.8.8/
使用 perl -V 查找得到 perl 的@INC,将 lib 下的内容copy到INC的任一路径中。
3,复制以下 perl 制表脚本,保存为 chart_create.pl
[root@localhost ~]# more chart_create.pl
- #!/usr/bin/perl
- #chart_create.pl
- #author: [email protected]
- #url: http://supersun.biz
-
-
- use strict;
- use File::Basename;
- use lib dirname($0);
- use perlchartdir;
- use Getopt::Std;
-
- sub line_grap;
- sub bar_grap;
- sub usage;
-
- my %opts;
- getopt('fmtpxy',\%opts);
-
- my $file=$opts{f};
- my $mode=$opts{m};
- my $title=$opts{t};
- my $png_file=$opts{p};
- my $x_title=$opts{x};
- my $y_title=$opts{y};
-
- $x_title="X" if $x_title eq '';
- $y_title="Y" if $y_title eq '';
- usage unless $mode eq "line" || $mode eq "bar";
- usage if -z $title || -z $png_file;
- die "$file isn't exsit\n" unless -f $file;
-
-
-
- my $data={};
- open FD,$file;
- my @entries=<FD>;
- my $head=[];
- @{$head}=split /\s+/,$entries[0];
- foreach my $entry (@entries){
- chomp $entry;
- my @utils=split /\s+/,$entry;
- foreach my $i (0..scalar(@$head)-1){
- push @{$data{$head[$i]}},$utils[$i];
- }
- }
- if($mode eq "bar"){
- bar_grap($png_file,$title,$x_title,$y_title,$head,$data);
- }else{
- line_grap($png_file,$title,$x_title,$y_title,$head,$data);
- }
-
-
-
-
- sub usage {
- print "$0 -f datafile -m line|bar -t graph_title -p image_name\n";
- exit;
- }
-
- sub line_grap {
- my ($file,$head,$x_title,$y_title,$lable,$data)=@_;
-
- my $x_lable_tag=shift @$lable;
- print "$x_lable_tag\n";
- shift @{$data{$x_lable_tag}};
- my @corlor=(0xffff00, 0x00ff00, 0x9999ff, 0xff0000, 0x223366,0xff8800, 0xa0bdc4, 0x999966, 0x333366, 0xc3c3e6);
-
- my $c = new XYChart(1200, 400, 0xffffc0, 0x000000, 1);
- $c->setPlotArea(80, 50, 1100, 300, 0xffffff, -1, -1, 0xc0c0c0, -1);
- $c->addLegend(45, 12, 0, "", 8)->setBackground($perlchartdir::Transparent);
- $c->addTitle($head, "arialbd.ttf", 9, 0xffffff)->setBackground($c->patternColor([0x004000, 0x008000], 2));
- $c->yAxis()->setTitle($y_title);
- $c->xAxis()->setTitle($x_title);
- $c->yAxis()->setLabelFormat("{value}");
- $c->xAxis()->setLabels($data{$x_lable_tag});
- my $layer = $c->addLineLayer();
- foreach my $util (@$lable){
- my $col=shift @corlor;
- my $tag=shift @{$data{$util}};
- $layer->addDataSet($data{$util}, $col, $tag)->setDataSymbol($perlchartdir::SquareSymbol, 7);
- }
-
-
-
- #$layer->setDataLabelFormat("{value}");
- $c->makeChart("$file")
- }
-
- sub bar_grap {
- my ($file,$head,$x_title,$y_title,$lable,$data)=@_;
- my $x_lable_tag= shift @$lable;
- print "$x_lable_tag\n";
- shift @{$data{$x_lable_tag}};
-
- my @corlor=(0xffff00, 0x00ff00, 0x9999ff, 0xff0000, 0x223366,0xff8800, 0xa0bdc4, 0x999966, 0x333366, 0xc3c3e6);
-
- my $c = new XYChart(1200, 400);
- $c->addTitle($head, "", 10);
- $c->setPlotArea(80, 50, 1100, 300, 0xffffc0, 0xffffe0);
- $c->addLegend(55, 18, 0, "", 8)->setBackground($perlchartdir::Transparent);
- $c->yAxis()->setTitle($y_title);
- $c->xAxis()->setTitle($x_title);
- $c->yAxis()->setTopMargin(20);
- $c->xAxis()->setLabels($data{$x_lable_tag});
- my $layer = $c->addBarLayer2($perlchartdir::Side, 7);
- foreach my $util (@$lable){
- my $col=shift @corlor;
- my $tag=shift @{$data{$util}};
- $layer->addDataSet($data{$util},$col, "$tag");
- }
- $c->makeChart("$file")
- }
[root@localhost ~]# ./chart_create.pl
QUOTE:
./chart_create.pl -f datafile -m line|bar -t graph_title -p image_name
chart_create.pl -f 数据文件 -m 图表类型 -t 图表标题 -p 图片文件名 -x X轴标题 -y Y轴标题
图表类型为:
bar 柱状图
line 曲线图
chart_create.pl -f 数据文件 -m 图表类型 -t 图表标题 -p 图片文件名 -x X轴标题 -y Y轴标题
图表类型为:
bar 柱状图
line 曲线图
数据文件格式如下:
[root@localhost ~]# more data
QUOTE:
date v1 v2 v3
20090101 3031132 3253513 3035196
20090102 3610310 3545421 3332149
20090103 3756983 3815154 3997797
20090104 3926538 3875646 3902116
20090105 3905990 4000435 3936811
20090101 3031132 3253513 3035196
20090102 3610310 3545421 3332149
20090103 3756983 3815154 3997797
20090104 3926538 3875646 3902116
20090105 3905990 4000435 3936811
5,运行此脚本后,制图表如下:
- perl chart_create.pl -f data -m line -t "mobile" -p line.png -x date -y pv
- perl chart_create.pl -f data -m bar -t "mobile " -p bar.png -x date -y pv
原文来自http://blog.chinaunix.net/u/25264/showart_1918205.html
作者: jiannma 发布时间: 2010-09-04
是挺不错的,但似乎是商业的图表库,需要license.
作者: climby 发布时间: 2010-09-04
相关阅读 更多
热门阅读
-
 office 2019专业增强版最新2021版激活秘钥/序列号/激活码推荐 附激活工具
阅读:74
-
 如何安装mysql8.0
阅读:31
-
 Word快速设置标题样式步骤详解
阅读:28
-
 20+道必知必会的Vue面试题(附答案解析)
阅读:37
-
 HTML如何制作表单
阅读:22
-
 百词斩可以改天数吗?当然可以,4个步骤轻松修改天数!
阅读:31
-
 ET文件格式和XLS格式文件之间如何转化?
阅读:24
-
 react和vue的区别及优缺点是什么
阅读:121
-
 支付宝人脸识别如何关闭?
阅读:21
-
 腾讯微云怎么修改照片或视频备份路径?
阅读:28